UNDERSTANDING CORRELATED COLOR TEMPERATURE (CCT)
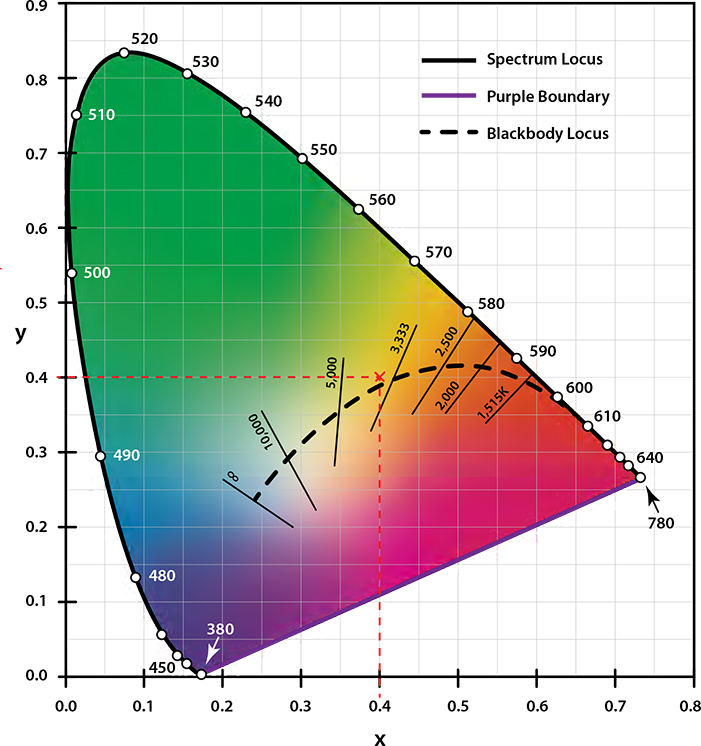
There are a number of color combinations that can be used to create White Light, or a particular Color Temperature. The Chromaticity Chart is used to qualify the color of the light that is produced by a lamp. This is called a lamp’s Color Temperature. This can be seen on the Chromaticity chart. Color temperature is specified in degrees Kelvin (°K)*.

THE GRID
The chart is laid over an X, Y grid with numbers at the left and bottom used to define an exact point on the chart.
THE NUMBERS
The numbers surrounding the curved part of the color form represent wavelengths in nanometers in the color spectrum.
HOW TO READ THE CHART
The curved line is called the “Black Body Curve” and
represents the color temperature of an object (for instance a piece of steel) that is heated until it gives off light. The curve begins at the extreme right of the of the chart and moves to the left. As the steel is heated, its color (Color Temperature) changes from black to dull red, orange, yellow, white and finally blue, as the heat increases.
The lines intersecting the black body curve represent the range of points on the chart that will result in a specific color temperature.
A Metal Halide lamp with Chromaticity coordinates of
X=0.396, Y=0.402 shows that the lamp has a 3800K Color Temperature (shown by the red “X”).
*Kelvin is a temperature scale in which zero occurs at absolute zero and each degree equals one Kelvin.
Contact: Eason Wang
Phone: +86-755-13751010017
E-mail: info@iec-equipment.com
Add: 1F Junfeng Building, Gongle, Xixiang, Baoan District, Shenzhen, Guangdong, China